Demo 1:K3 量子行走
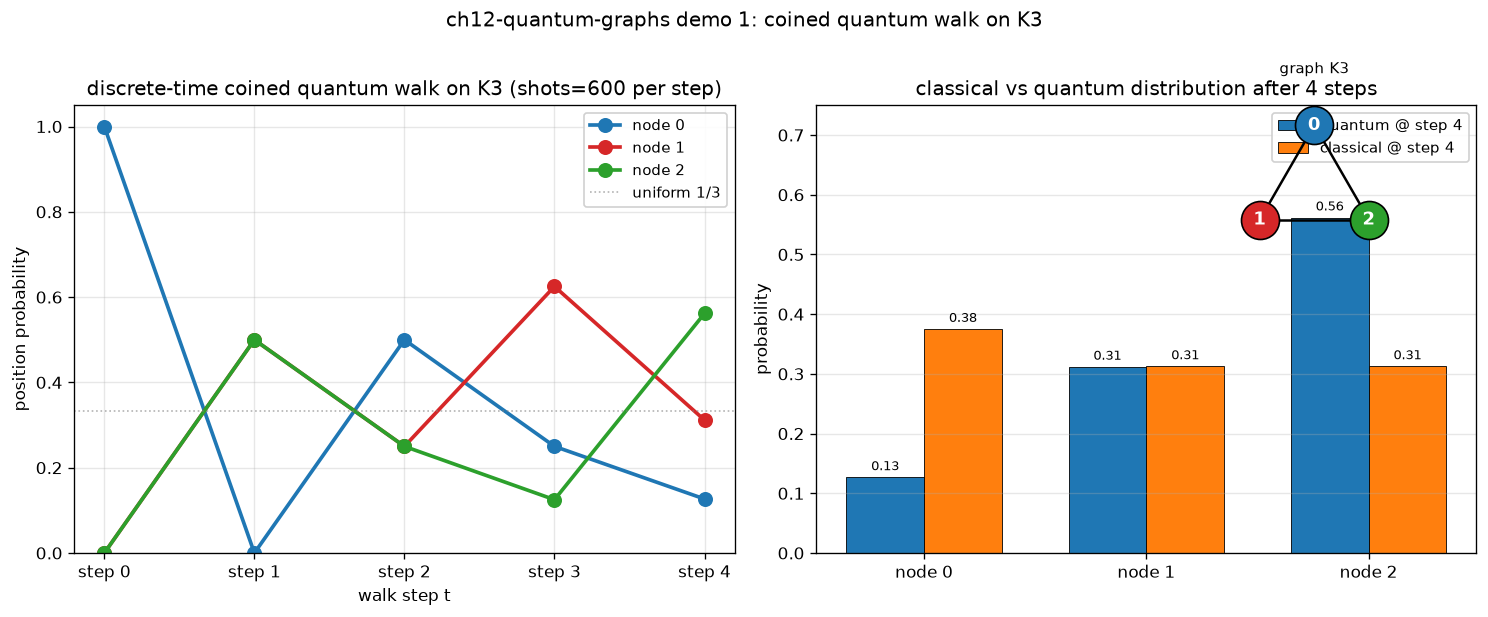
可视化:双图(轨迹+经典对照) —— 4 步位置概率演化
对应教程:第 12 章 量子图算法 中相关小节 · 依赖安装:pip install "unified-quantum[visualization,simulation]"
实现要点
核心:K3 (3-node complete graph) 也是 C3 (3-cycle)。一个 qubit 硬币 (q3) 加三个 一元编码位置 q2 q1 q0,节点 k 的"1"在 q[k]。每一步 = H(q3) 然后受控移位: coin=0 → INC (|001⟩→|010⟩→|100⟩→|001⟩),coin=1 → DEC (逆序)。INC 与 DEC 都分解成两个 SWAP(q0,q1) 和 SWAP(q0,q2),在 uniqc 中再用 CSWAP(q3,…) 做受控选择。和经典随机游走对比:量子游走呈现单向漂移(来自单向硬币的干涉), 而经典游走在三节点环上保持振荡。
完整源码
demos/ch12-quantum-graphs/01_graph_walk.py
  1"""
  2ch12-quantum-graphs demo 1: discrete-time coined quantum walk on K3
  3
  4对应教程:chenzhaoyun.com/quantum-tutorial/ch12-quantum-graphs/adjacency-matrix-properties.html
  5核心:K3 (3-node complete graph) 也是 C3 (3-cycle)。一个 qubit 硬币 (q3) 加三个
  6     一元编码位置 q2 q1 q0,节点 k 的"1"在 q[k]。每一步 = H(q3) 然后受控移位:
  7     coin=0 → INC (|001⟩→|010⟩→|100⟩→|001⟩),coin=1 → DEC (逆序)。INC 与 DEC
  8     都分解成两个 SWAP(q0,q1) 和 SWAP(q0,q2),在 uniqc 中再用 CSWAP(q3,…)
  9     做受控选择。和经典随机游走对比:量子游走呈现单向漂移(来自单向硬币的干涉),
 10     而经典游走在三节点环上保持振荡。
 11
 12依赖:pip install unified-quantum[visualization]
 13运行:python demos/ch12-quantum-graphs/01_graph_walk.py
 14"""
 15from __future__ import annotations
 16
 17from pathlib import Path
 18
 19import matplotlib
 20matplotlib.use("Agg")
 21import matplotlib.pyplot as plt
 22import numpy as np
 23
 24from uniqc import Circuit, submit_task, wait_for_result
 25
 26OUT = Path(__file__).parent
 27SHOTS = 600
 28N_NODES = 3
 29N_QUBITS = 4  # q0 q1 q2 for unary position, q3 for coin
 30
 31# uniqc bit-string for a 4-qubit circuit reads "q3 q2 q1 q0" (MSB first).
 32# Unary position: node k has qk = 1, so the "1" sits at bit-string index (3-k).
 33# The coin is q3 (bit-string index 0).
 34BS_TO_NODE = {}
 35for node in range(N_NODES):
 36    for coin in (0, 1):
 37        chars = ["0", "0", "0", "0"]
 38        chars[3 - node] = "1"   # position: q0 at idx 3, q1 at idx 2, q2 at idx 1
 39        chars[0] = str(coin)    # coin: q3 at idx 0
 40        BS_TO_NODE["".join(chars)] = node
 41
 42
 43def walk_circuit(num_steps: int) -> Circuit:
 44    """Discrete-time coined quantum walk on K3=C3 starting at node 0."""
 45    c = Circuit()
 46    c.x(0)                              # initial |001⟩ (node 0)
 47    for _ in range(num_steps):
 48        c.h(3)                          # coin toss
 49        # INC if coin=0 : X(3); CSWAP(3,0,1); CSWAP(3,0,2); X(3)
 50        c.x(3); c.cswap(3, 0, 1); c.cswap(3, 0, 2); c.x(3)
 51        # DEC if coin=1 : CSWAP(3,0,2); CSWAP(3,0,1)
 52        c.cswap(3, 0, 2); c.cswap(3, 0, 1)
 53    for q in range(N_QUBITS):
 54        c.measure(q)
 55    return c
 56
 57
 58def classical_random_walk(num_steps: int) -> np.ndarray:
 59    """P[node, t] for a classical random walk on C3 starting at node 0."""
 60    P = np.zeros((num_steps + 1, N_NODES))
 61    P[0, 0] = 1.0
 62    for t in range(1, num_steps + 1):
 63        P[t] = 0.0
 64        for prev in range(N_NODES):
 65            for nxt in [(prev + 1) % N_NODES, (prev - 1) % N_NODES]:
 66                P[t, nxt] += P[t - 1, prev] * 0.5
 67    return P
 68
 69
 70# === 1. Run quantum walk for steps 0..4 ===
 71print("ch12-quantum-graphs-demo-1: coined quantum walk on K3 = C3")
 72print(f"  qubits: {N_QUBITS} (3 unary position + 1 coin)")
 73print(f"  shots per circuit: {SHOTS}")
 74
 75quant_probs = np.zeros((5, N_NODES))
 76for t in range(5):
 77    c = walk_circuit(t)
 78    r = wait_for_result(
 79        submit_task(circuit=c, backend="dummy:local:simulator", shots=SHOTS)
 80    )
 81    counts = r.counts
 82    total = sum(counts.values())
 83    for bs, cnt in counts.items():
 84        node = BS_TO_NODE.get(bs, -1)
 85        if node >= 0:
 86            quant_probs[t, node] += cnt / total
 87    print(f"  step {t}: " + ", ".join(
 88        f"P(node {n})={quant_probs[t, n]:.3f}" for n in range(N_NODES)
 89    ))
 90
 91total_shots = SHOTS * 5
 92
 93# === 2. Classical random walk comparison ===
 94class_probs = classical_random_walk(4)
 95
 96# === 3. matplotlib 可视化 ===
 97fig, (ax1, ax2) = plt.subplots(1, 2, figsize=(12.5, 5.0))
 98
 99steps = np.arange(5)
100node_colors = ["#1f77b4", "#d62728", "#2ca02c"]
101node_labels = [f"node {n}" for n in range(N_NODES)]
102
103# Left: quantum walk — probability of each node over 5 steps
104for n in range(N_NODES):
105    ax1.plot(steps, quant_probs[:, n], "-o", color=node_colors[n],
106             lw=2.2, ms=8, label=node_labels[n])
107ax1.axhline(1.0 / N_NODES, color="gray", ls=":", lw=1, alpha=0.6,
108            label=f"uniform 1/{N_NODES}")
109ax1.set_xticks(steps)
110ax1.set_xticklabels([f"step {t}" for t in steps])
111ax1.set_ylim(0, 1.05)
112ax1.set_ylabel("position probability")
113ax1.set_xlabel("walk step t")
114ax1.set_title("discrete-time coined quantum walk on K3 (shots=600 per step)")
115ax1.grid(alpha=0.3)
116ax1.legend(loc="upper right", fontsize=9, framealpha=0.9)
117
118# Right: classical vs quantum at each node, side-by-side bars
119bar_w = 0.35
120x = np.arange(N_NODES)
121ax2.bar(x - bar_w / 2, quant_probs[4], bar_w, color="#1f77b4",
122        ec="black", lw=0.5, label="quantum @ step 4")
123ax2.bar(x + bar_w / 2, class_probs[4], bar_w, color="#ff7f0e",
124        ec="black", lw=0.5, label="classical @ step 4")
125for n in range(N_NODES):
126    ax2.text(n - bar_w / 2, quant_probs[4, n] + 0.012,
127             f"{quant_probs[4, n]:.2f}", ha="center", fontsize=8)
128    ax2.text(n + bar_w / 2, class_probs[4, n] + 0.012,
129             f"{class_probs[4, n]:.2f}", ha="center", fontsize=8)
130ax2.set_xticks(x)
131ax2.set_xticklabels(node_labels)
132ax2.set_ylim(0, 0.75)
133ax2.set_ylabel("probability")
134ax2.set_title("classical vs quantum distribution after 4 steps")
135ax2.grid(alpha=0.3, axis="y")
136ax2.legend(loc="upper right", fontsize=9, framealpha=0.9)
137
138# K3 graph inset (sketch)
139inset = fig.add_axes([0.78, 0.55, 0.20, 0.35])
140theta = np.array([90, 210, 330]) * np.pi / 180.0
141xs, ys = 0.6 * np.cos(theta), 0.6 * np.sin(theta)
142for i in range(3):
143    for j in range(i + 1, 3):
144        inset.plot([xs[i], xs[j]], [ys[i], ys[j]], "k-", lw=1.5)
145for n, (x_, y_) in enumerate(zip(xs, ys)):
146    fc = node_colors[n]
147    inset.scatter(x_, y_, s=520, c=fc, ec="black", zorder=3)
148    inset.text(x_, y_, str(n), ha="center", va="center", fontsize=11,
149               fontweight="bold", color="white", zorder=4)
150inset.set_xlim(-1.0, 1.0)
151inset.set_ylim(-1.0, 1.0)
152inset.set_aspect("equal")
153inset.axis("off")
154inset.set_title("graph K3", fontsize=9)
155
156plt.suptitle("ch12-quantum-graphs demo 1: coined quantum walk on K3", y=1.02)
157plt.tight_layout()
158out_path = OUT / "01_graph_walk.png"
159plt.savefig(out_path, dpi=120, bbox_inches="tight")
160plt.close()
161
162# === 4. stdout 关键统计 ===
163print(f"\n  total shots across {5} step counts: {total_shots}")
164print(f"  quantum walk position distribution at each step:")
165for t in range(5):
166    spread = np.max(quant_probs[t]) - np.min(quant_probs[t])
167    print(f"    step {t}: max-min spread = {spread:.3f}")
168print(f"  classical @ step 4: P = {np.round(class_probs[4], 3).tolist()}")
169print(f"  quantum   @ step 4: P = {np.round(quant_probs[4], 3).tolist()}")
170print(f"  l1 distance classical vs quantum @ step 4: "
171      f"{np.abs(quant_probs[4] - class_probs[4]).sum():.3f}")
172print(f"  quantum entropy @ step 4: "
173      f"{-np.sum(quant_probs[4] * np.log(quant_probs[4] + 1e-12)):.3f}")
174print(f"  PNG -> {out_path}")
运行结果
运行方式
# 仓库根目录执行;输出 PNG 到 demos/ch12-quantum-graphs/01_graph_walk.png,关键统计到 stdout
.venv/bin/python3 demos/ch12-quantum-graphs/01_graph_walk.py