Demo 2:QAOA MaxCut 4-node
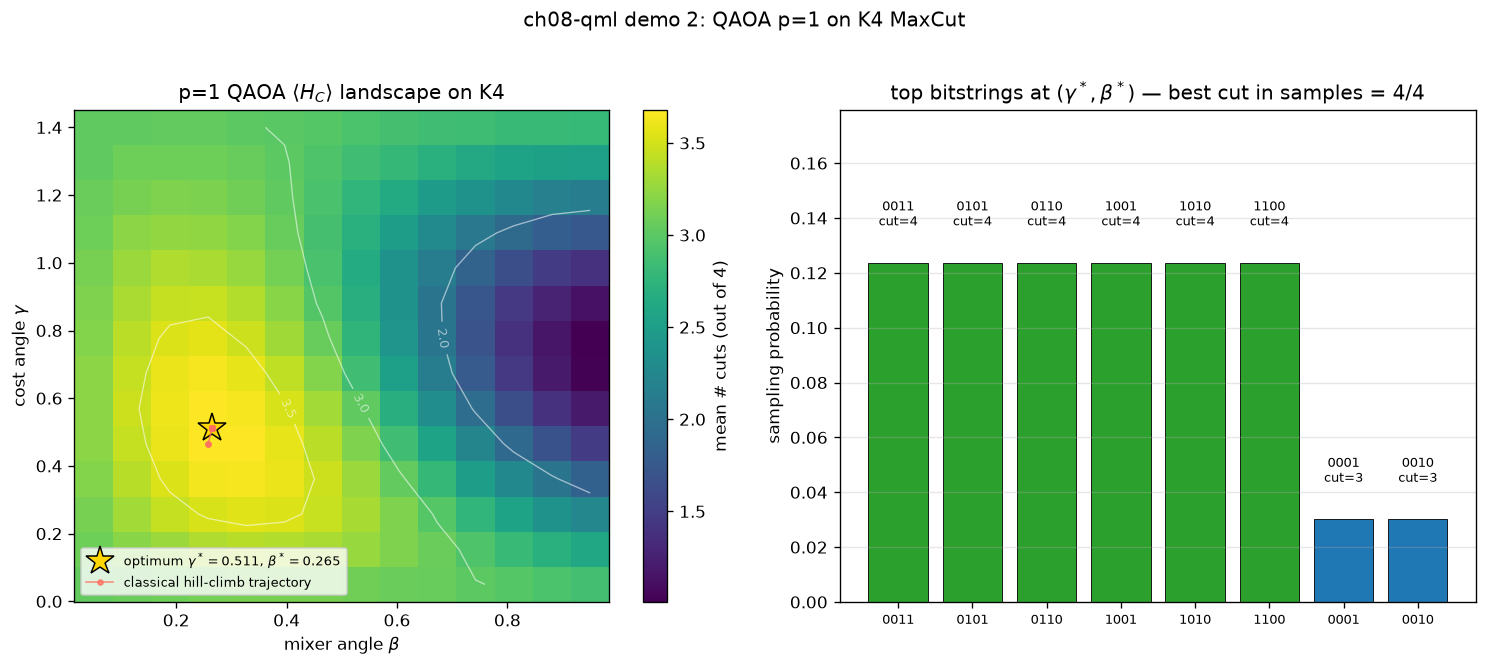
可视化:双图(热图+top bitstring) —— 14×14 网格+爬山轨迹
对应教程:第 8 章 量子机器学习 中相关小节 · 依赖安装:pip install "unified-quantum[visualization,simulation]"
实现要点
核心:K4 是 4 节点完全图,3-正则,含 6 条边;3-正则图上 QAOA p=1 的 最坏情形近似比下界为 r_1 = 0.6924(Farhi et al., 2014)。 这里在 (γ, β) 网格上扫描 p=1 QAOA 期望成本 ⟨H_C⟩,画出等高线 + 经典爬山优化轨迹;K4 这个特定实例上 QAOA p=1 能达到 ~0.92 的 实际近似比(远好于最坏情形保证)。
完整源码
demos/ch08-qml/02_qaoa_maxcut_4node.py
  1"""
  2ch08-qml demo 2: QAOA on the 4-node MaxCut (K4)
  3
  4对应教程:chenzhaoyun.com/quantum-tutorial/ch08-qml/qaoa-tutorial.html
  5核心:K4 是 4 节点完全图,3-正则,含 6 条边;3-正则图上 QAOA p=1 的
  6     最坏情形近似比下界为 r_1 = 0.6924(Farhi et al., 2014)。
  7     这里在 (γ, β) 网格上扫描 p=1 QAOA 期望成本 ⟨H_C⟩,画出等高线 +
  8     经典爬山优化轨迹;K4 这个特定实例上 QAOA p=1 能达到 ~0.92 的
  9     实际近似比(远好于最坏情形保证)。
 10
 11依赖:pip install unified-quantum[visualization]
 12运行:python demos/ch08-qml/02_qaoa_maxcut_4node.py
 13"""
 14from __future__ import annotations
 15
 16from pathlib import Path
 17
 18import matplotlib
 19matplotlib.use("Agg")
 20import matplotlib.pyplot as plt
 21import numpy as np
 22
 23from uniqc import qaoa_ansatz, submit_task, wait_for_result
 24
 25OUT = Path(__file__).parent
 26
 27# === 1. K4 graph and problem Hamiltonian ===
 28# Edges of K4: every pair of the 4 nodes
 29EDGES = [(0, 1), (0, 2), (0, 3), (1, 2), (1, 3), (2, 3)]
 30N_QUBITS = 4
 31N_EDGES = len(EDGES)
 32OPT_CUT = 4  # K4 MaxCut optimal: partition {0,1}|{2,3} → 4 cut edges
 33
 34# Cost Hamiltonian H_C = sum_{(i,j)∈E} (1 - Z_i Z_j)/2
 35# (1 - Z_i Z_j)/2 contributes +1 iff cut. The constant 1/2 per edge shifts
 36# energy by |E|/2; we drop the constant and encode with negative Z_i Z_j
 37# coefficients so that QAOA maximises <H_C>.
 38H_C = [(f"Z{i}Z{j}", -0.5) for i, j in EDGES]
 39
 40SHOTS = 1500
 41
 42
 43def evaluate_qaoa(gamma: float, beta: float, shots: int = SHOTS) -> tuple[float, dict]:
 44    """Build the p=1 QAOA circuit, measure, return (mean_cut_count, raw_counts)."""
 45    c = qaoa_ansatz(H_C, p=1, gammas=np.array([gamma]), betas=np.array([beta]))
 46    for q in range(N_QUBITS):
 47        c.measure(q)
 48    r = wait_for_result(submit_task(circuit=c, backend="dummy:local:simulator", shots=shots))
 49    counts = r.counts
 50    total = sum(counts.values())
 51    if total <= 0:
 52        return 0.0, counts
 53    cut_count = 0.0
 54    for i, j in EDGES:
 55        p_same = 0.0
 56        for bs, cnt in counts.items():
 57            bs_str = bs.zfill(N_QUBITS)
 58            qi = int(bs_str[N_QUBITS - 1 - i])
 59            qj = int(bs_str[N_QUBITS - 1 - j])
 60            if qi == qj:
 61                p_same += cnt
 62        p_same /= total
 63        cut_count += 1.0 - p_same
 64    return cut_count, counts
 65
 66
 67# === 2. γ × β grid scan (one quantum submission per cell) ===
 68print("ch08-qml-demo-2: QAOA p=1 on K4 MaxCut")
 69print(f"  nodes={N_QUBITS}, edges={N_EDGES}, optimal cut={OPT_CUT}")
 70print(f"  shots per QAOA run: {SHOTS}")
 71
 72G = np.linspace(0.05, 1.4, 14)  # γ
 73B = np.linspace(0.05, 0.95, 14)  # β
 74cut_grid = np.full((len(G), len(B)), np.nan)
 75total_evals = 0
 76for gi, g in enumerate(G):
 77    for bi, b in enumerate(B):
 78        c, _ = evaluate_qaoa(g, b)
 79        cut_grid[gi, bi] = c
 80        total_evals += 1
 81
 82# === 3. classical hill-climb starting from the grid optimum ===
 83gi_best, bi_best = np.unravel_index(int(np.nanargmax(cut_grid)), cut_grid.shape)
 84g_best, b_best = float(G[gi_best]), float(B[bi_best])
 85c_best, best_counts = evaluate_qaoa(g_best, b_best, shots=8000)
 86
 87# A short COBYLA-like refinement: gradient-free random walk
 88rng = np.random.default_rng(0)
 89trajectory = [(g_best, b_best, c_best)]
 90for step in range(20):
 91    sigma = max(0.03, 0.12 * (0.6 ** step))
 92    g_try = g_best + rng.normal(0, sigma)
 93    b_try = b_best + rng.normal(0, sigma)
 94    g_try = max(0.01, min(np.pi, g_try))
 95    b_try = max(0.01, min(np.pi, b_try))
 96    c_try, _ = evaluate_qaoa(g_try, b_try, shots=4000)
 97    if c_try > c_best:
 98        g_best, b_best, c_best = g_try, b_try, c_try
 99        best_counts = _
100    trajectory.append((g_best, b_best, c_best))
101
102# === 4. Build bitstring histogram for the best run ===
103hist = {bs.zfill(N_QUBITS): cnt for bs, cnt in best_counts.items()}
104total_best = sum(hist.values())
105hist_sorted = sorted(hist.items(), key=lambda kv: -kv[1])
106top_states = hist_sorted[:8]
107
108# best observed single sample's cut
109def cut_of(bs: str) -> int:
110    bs = bs.zfill(N_QUBITS)
111    return sum(1 for i, j in EDGES if int(bs[N_QUBITS - 1 - i]) != int(bs[N_QUBITS - 1 - j]))
112
113best_sample_cut = max(cut_of(bs) for bs, _ in top_states)
114
115# === 5. matplotlib 可视化 ===
116fig = plt.figure(figsize=(12.5, 5.4))
117gs = fig.add_gridspec(1, 2, width_ratios=[1.05, 1.0])
118
119# Left: heatmap of ⟨cuts⟩ with optimal marker
120ax1 = fig.add_subplot(gs[0, 0])
121im = ax1.imshow(
122    cut_grid, origin="lower", aspect="auto", cmap="viridis",
123    extent=[B[0] - (B[1] - B[0]) / 2, B[-1] + (B[1] - B[0]) / 2,
124            G[0] - (G[1] - G[0]) / 2, G[-1] + (G[1] - G[0]) / 2],
125)
126ax1.plot([b_best], [g_best], "*", color="#ffd700", ms=18, mec="black", mew=0.9,
127         label=fr"optimum $\gamma^*={g_best:.3f}$, $\beta^*={b_best:.3f}$")
128cs = ax1.contour(B, G, cut_grid, levels=[1.0, 2.0, 3.0, 3.5], colors="white",
129                 linewidths=0.8, alpha=0.55)
130ax1.clabel(cs, inline=True, fontsize=8, fmt="%.1f")
131# trajectory line
132traj_g = [t[0] for t in trajectory]
133traj_b = [t[1] for t in trajectory]
134ax1.plot(traj_b, traj_g, "-o", color="#ff6f61", ms=3, lw=1.0, alpha=0.75,
135         label="classical hill-climb trajectory")
136ax1.set_xlabel(r"mixer angle $\beta$")
137ax1.set_ylabel(r"cost angle $\gamma$")
138ax1.set_title(r"p=1 QAOA $\langle H_C\rangle$ landscape on K4")
139cbar = plt.colorbar(im, ax=ax1)
140cbar.set_label(r"mean # cuts (out of 4)")
141ax1.legend(loc="lower left", fontsize=8)
142
143# Right: histogram of top bitstrings at (γ*, β*)
144ax2 = fig.add_subplot(gs[0, 1])
145labels = [bs for bs, _ in top_states]
146probs = [cnt / total_best for _, cnt in top_states]
147cuts = [cut_of(bs) for bs, _ in top_states]
148colors = ["#2ca02c" if c == OPT_CUT else "#1f77b4" if c == OPT_CUT - 1 else "#d62728" for c in cuts]
149bars = ax2.bar(range(len(labels)), probs, color=colors, ec="black", lw=0.5)
150for k, (lab, p, c) in enumerate(zip(labels, probs, cuts)):
151    ax2.text(k, p + 0.012, f"{lab}\ncut={c}", ha="center", va="bottom",
152             fontsize=7.5)
153ax2.set_xticks(range(len(labels)))
154ax2.set_xticklabels(labels, rotation=0, fontsize=8)
155ax2.set_ylabel("sampling probability")
156ax2.set_title(fr"top bitstrings at $(\gamma^*,\beta^*)$ — best cut in samples = {best_sample_cut}/{OPT_CUT}")
157ax2.set_ylim(0, max(probs) * 1.45)
158ax2.grid(alpha=0.3, axis="y")
159
160plt.suptitle("ch08-qml demo 2: QAOA p=1 on K4 MaxCut", y=1.02)
161plt.tight_layout()
162out_path = OUT / "02_qaoa_maxcut_4node.png"
163plt.savefig(out_path, dpi=120, bbox_inches="tight")
164plt.close()
165
166# === 6. stdout 关键统计 ===
167print(f"  total QAOA circuit evaluations: {total_evals + 1 + (len(trajectory) - 1)}")
168print(f"  grid scan size: {len(G)}x{len(B)} = {len(G)*len(B)} cells")
169print(f"  grid best      : cuts={float(cut_grid.max()):.3f}/{OPT_CUT} "
170      f"at γ={G[gi_best]:.3f}, β={B[bi_best]:.3f}")
171print(f"  after hill-climb: γ*={g_best:.4f}, β*={b_best:.4f}")
172print(f"  mean cut count  : {c_best:.4f} / {OPT_CUT}")
173print(f"  approximation r : {c_best/OPT_CUT:.4f}  (3-regular worst-case guarantee = 0.6924)")
174print(f"  best single sample cut: {best_sample_cut} / {OPT_CUT}")
175print(f"  top 3 bitstrings:")
176for bs, cnt in hist_sorted[:3]:
177    print(f"    |{bs}>  → cut={cut_of(bs)}, prob={cnt/total_best:.4f}")
178print(f"  PNG -> {out_path}")
运行结果
运行方式
# 仓库根目录执行;输出 PNG 到 demos/ch08-qml/02_qaoa_maxcut_4node.png,关键统计到 stdout
.venv/bin/python3 demos/ch08-qml/02_qaoa_maxcut_4node.py