Demo 1:参数化 RY 扫描¶
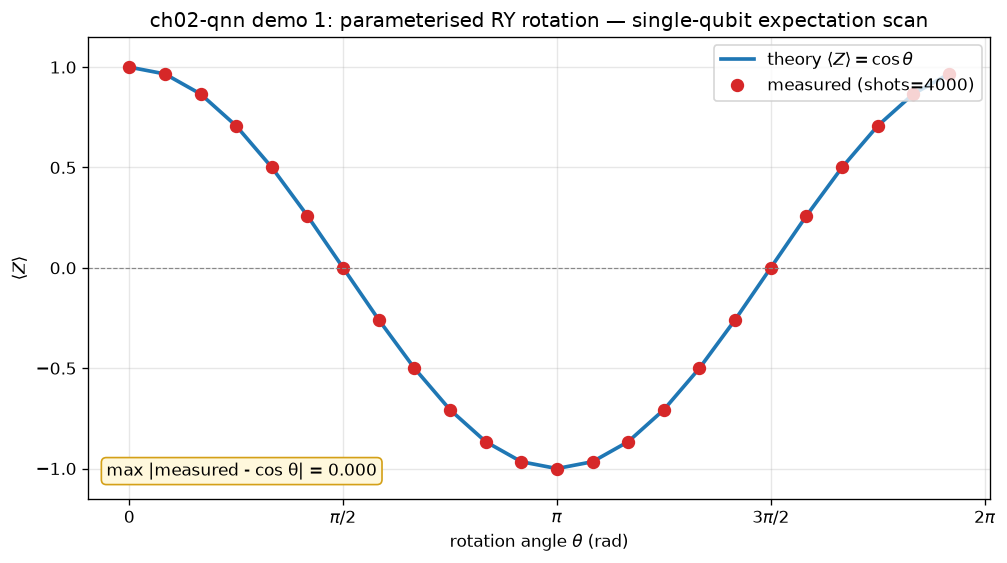
可视化:单图曲线+误差条 —— 扫描 θ 画 ⟨Z⟩ = cos θ 曲线 + 误差标注
对应教程:第 2 章 量子神经网络 中相关小节 · 依赖安装:pip install "unified-quantum[visualization,simulation]"
实现要点¶
核心:演示参数化门 RY(θ)|0⟩ 的输出态在 Z 基下的期望值 ⟨Z⟩ = ⟨0|RY(θ)† Z RY(θ)|0⟩ = cos(θ) 扫描 θ ∈ [0, 2π],对比理论 cos(θ) 曲线和量子线路测量值。
完整源码¶
demos/ch02-qnn/01_parametrized_rx_ry.py¶
 1"""
 2ch02-qnn demo 1: parameterised RY rotation scan
 3
 4对应教程:chenzhaoyun.com/quantum-tutorial/ch02-quantum-nn/parametrized-gates-appendix.html
 5核心:演示参数化门 RY(θ)|0⟩ 的输出态在 Z 基下的期望值
 6       ⟨Z⟩ = ⟨0|RY(θ)† Z RY(θ)|0⟩ = cos(θ)
 7扫描 θ ∈ [0, 2π],对比理论 cos(θ) 曲线和量子线路测量值。
 8
 9依赖:pip install unified-quantum[visualization]
10运行:python demos/ch02-qnn/01_parametrized_rx_ry.py
11"""
12from __future__ import annotations
13
14from pathlib import Path
15
16import matplotlib
17matplotlib.use("Agg")
18import matplotlib.pyplot as plt
19import numpy as np
20
21from uniqc import Circuit, submit_task, wait_for_result
22
23OUT = Path(__file__).parent
24
25# === 1. 扫描参数,构建多条 1-qubit 线路 ===
26N_POINTS = 24
27thetas = np.linspace(0.0, 2 * np.pi, N_POINTS, endpoint=False)
28shots = 4000
29
30measured = np.zeros(N_POINTS)
31for i, theta in enumerate(thetas):
32    c = Circuit()
33    c.ry(0, float(theta))
34    c.measure(0)
35    task_id = submit_task(circuit=c, backend="dummy:local:simulator", shots=shots)
36    result = wait_for_result(task_id)
37    probs = result.probabilities
38    # ⟨Z⟩ = P(0) - P(1)
39    measured[i] = probs.get("0", 0.0) - probs.get("1", 0.0)
40
41theory = np.cos(thetas)
42
43# === 2. matplotlib 可视化:理论 vs 测量,对照 cos(θ) 曲线 ===
44fig, ax = plt.subplots(figsize=(8.5, 4.8))
45ax.plot(thetas, theory, color="#1f77b4", lw=2.2, label=r"theory $\langle Z\rangle = \cos\theta$")
46ax.plot(thetas, measured, "o", color="#d62728", ms=7, label=f"measured (shots={shots})")
47ax.axhline(0.0, color="#888888", lw=0.7, ls="--")
48ax.set_xlabel(r"rotation angle $\theta$ (rad)")
49ax.set_ylabel(r"$\langle Z \rangle$")
50ax.set_title("ch02-qnn demo 1: parameterised RY rotation — single-qubit expectation scan")
51ax.set_xticks(np.linspace(0, 2 * np.pi, 5))
52ax.set_xticklabels([r"$0$", r"$\pi/2$", r"$\pi$", r"$3\pi/2$", r"$2\pi$"])
53ax.set_ylim(-1.15, 1.15)
54ax.grid(alpha=0.3)
55ax.legend(loc="upper right")
56
57max_abs_err = float(np.max(np.abs(measured - theory)))
58ax.text(
59    0.02, 0.05,
60    f"max |measured - cos θ| = {max_abs_err:.3f}",
61    transform=ax.transAxes, fontsize=10,
62    bbox=dict(boxstyle="round,pad=0.3", fc="#fff8dc", ec="#d4a017"),
63)
64
65plt.tight_layout()
66out_path = OUT / "01_parametrized_rx_ry.png"
67plt.savefig(out_path, dpi=120, bbox_inches="tight")
68plt.close()
69
70# === 3. stdout 关键统计 ===
71print("ch02-qnn-demo-1: parameterised RY rotation scan")
72print(f"  theta samples: {N_POINTS} over [0, 2π]")
73print(f"  shots per sample: {shots}")
74print(f"  max |measured - cos θ| = {max_abs_err:.4f}")
75print(f"  measurement at θ=π   : ⟨Z⟩_meas = {measured[N_POINTS // 2]:+.4f} (theory = -1)")
76print(f"  measurement at θ=π/2 : ⟨Z⟩_meas = {measured[N_POINTS // 4]:+.4f} (theory = 0)")
77print(f"  PNG -> {out_path}")
运行结果¶
运行方式¶
# 仓库根目录执行;输出 PNG 到 demos/ch02-qnn/01_parametrized_rx_ry.png,关键统计到 stdout
.venv/bin/python3 demos/ch02-qnn/01_parametrized_rx_ry.py