Demo 3:QSVT sign 近似
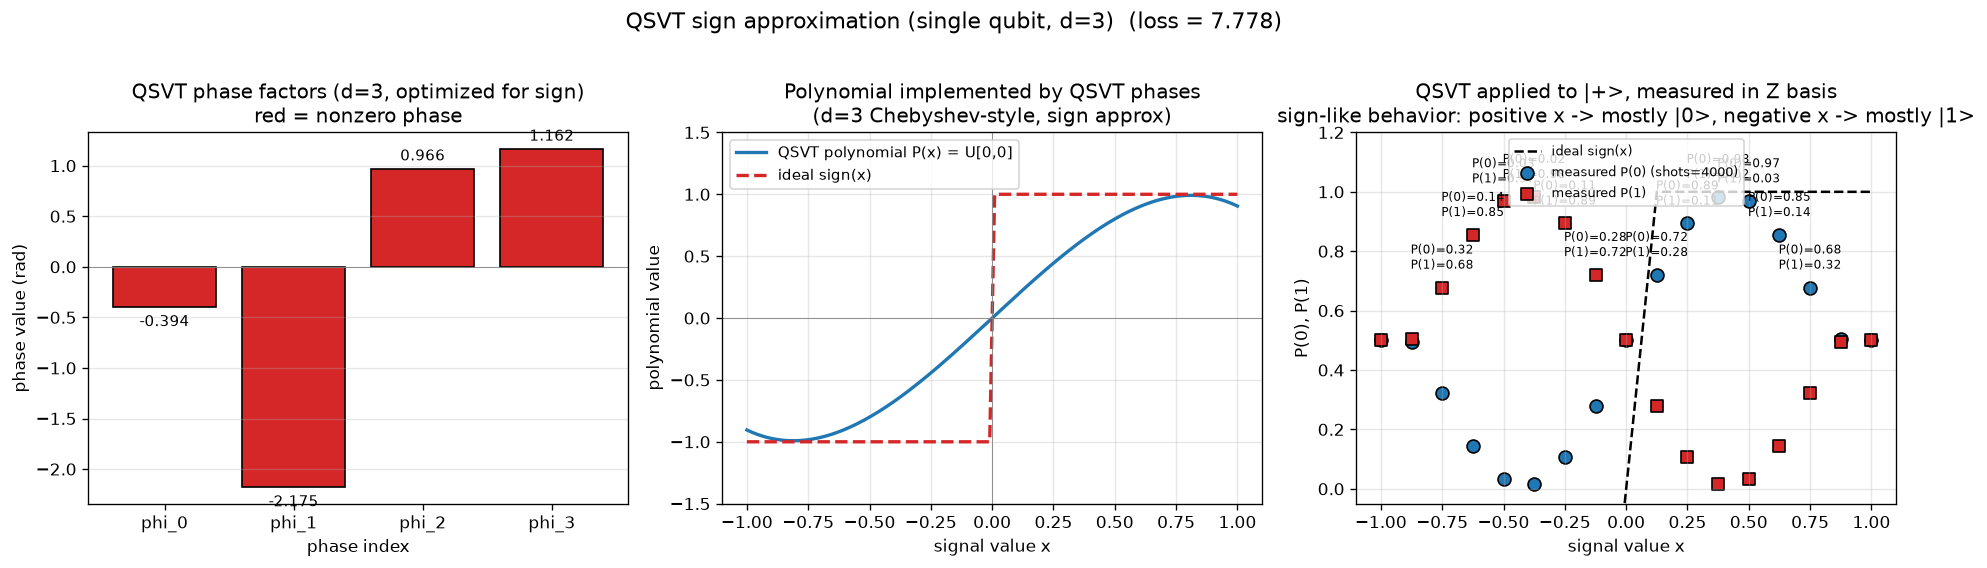
可视化:3 子图(相位+多项式+测量) —— 17 个 x 处 P(0)/P(1) 与 sign(x) 对比
对应教程:第 5 章 哈密顿量模拟与 QSP 中相关小节 · 依赖安装:pip install "unified-quantum[visualization,simulation]"
实现要点
模型: QSVT 在单比特上, 信号算子 W(x) = e^{i arccos(x) X} (在 X 基上对角), 处理器 S(phi) = e^{i phi Z} = R_z(2 phi). d=3 阶 QSVT: U_QSVT(x) = S(phi_0) W S(phi_1) W S(phi_2) W S(phi_3)
通过数值优化在 x in [-1, 1] 上最小化 ||U[0,0](x) - sign(x)||^2, 得到一组近似 sign 的相位因子. 把 QSVT 电路作用在 |+>, 测 P(0)/P(1).
相位因子只取 4 个参数, 所以多项式是次数 <= 3 的奇函数多项式, d=3 限制下 sign 只能近似, 不是精确符号函数.
完整源码
demos/ch05-hamiltonian-qsp/03_qsvt_sign.py
  1"""
  2ch05 演示 3: QSVT sign 近似 (单比特, d=3 奇数阶多项式).
  3
  4模型: QSVT 在单比特上, 信号算子 W(x) = e^{i arccos(x) X} (在 X 基上对角),
  5处理器 S(phi) = e^{i phi Z} = R_z(2 phi).
  6d=3 阶 QSVT: U_QSVT(x) = S(phi_0) W S(phi_1) W S(phi_2) W S(phi_3)
  7
  8通过数值优化在 x in [-1, 1] 上最小化 \\||U\\[0,0\\](x) - sign(x)\\||^2,
  9得到一组近似 sign 的相位因子. 把 QSVT 电路作用在 |+>, 测 P(0)/P(1).
 10
 11相位因子只取 4 个参数, 所以多项式是次数 <= 3 的奇函数多项式,
 12d=3 限制下 sign 只能近似, 不是精确符号函数.
 13
 14对应教程: chenzhaoyun.com/quantum-tutorial/ch05-hamiltonian-qsp/qsvt-tutorial.html
 15依赖: pip install unified-quantum[visualization]
 16运行: python demos/ch05-hamiltonian-qsp/03_qsvt_sign.py
 17"""
 18from uniqc import Circuit, submit_task, wait_for_result
 19import matplotlib
 20matplotlib.use("Agg")
 21import matplotlib.pyplot as plt
 22import numpy as np
 23from pathlib import Path
 24from scipy.optimize import minimize
 25
 26OUT = Path(__file__).parent
 27SHOTS = 4000
 28N_PHASES = 4  # d=3 -> 4 phases
 29
 30
 31def qs_unitary(x, phases):
 32    """Analytical QSVT unitary with W(x) = e^{i arccos(x) X} (standard convention)."""
 33    theta = np.arccos(x)
 34    c, si = np.cos(theta), np.sin(theta)
 35    W = np.array([[c, 1j * si], [1j * si, c]], dtype=complex)
 36    S = lambda phi: np.diag([np.exp(1j * phi), np.exp(-1j * phi)])
 37    U = S(phases[0]) @ W @ S(phases[1])
 38    U = U @ W @ S(phases[2])
 39    U = U @ W @ S(phases[3])
 40    return U
 41
 42
 43def loss_sign(phases):
 44    err = 0.0
 45    for x in np.linspace(-1, 1, 41):
 46        U = qs_unitary(x, phases)
 47        target = float(np.sign(x)) if abs(x) > 0.01 else 0.0
 48        err += abs(U[0, 0] - target) ** 2
 49    return err
 50
 51
 52result = minimize(loss_sign, [0.0] * N_PHASES, method="Nelder-Mead",
 53                   options={"xatol": 1e-7, "fatol": 1e-9, "maxiter": 5000})
 54PHASES = result.x.tolist()
 55
 56
 57def build_qsvt_circuit(x):
 58    theta = float(np.arccos(x))
 59    c = Circuit()
 60    c.h(0)
 61    c.rz(0, 2 * PHASES[0])
 62    c.rx(0, -2 * theta)
 63    c.rz(0, 2 * PHASES[1])
 64    c.rx(0, -2 * theta)
 65    c.rz(0, 2 * PHASES[2])
 66    c.rx(0, -2 * theta)
 67    c.rz(0, 2 * PHASES[3])
 68    return c
 69
 70
 71x_test = np.linspace(-1.0, 1.0, 17)
 72probs_p0 = []
 73probs_p1 = []
 74poly_vals = []
 75sign_vals = []
 76for x in x_test:
 77    c = build_qsvt_circuit(x)
 78    c.measure(0)
 79    res = wait_for_result(submit_task(circuit=c, backend="dummy:local:simulator",
 80                                      shots=SHOTS))
 81    cnt = res.counts
 82    total = sum(cnt.values())
 83    probs_p0.append(cnt.get("0", 0) / total)
 84    probs_p1.append(cnt.get("1", 0) / total)
 85    poly_vals.append(qs_unitary(x, PHASES)[0, 0].real)
 86    sign_vals.append(float(np.sign(x)) if abs(x) > 1e-9 else 0.0)
 87
 88
 89fig, axes = plt.subplots(1, 3, figsize=(16.0, 4.6))
 90
 91ax = axes[0]
 92phi_labels = [f"phi_{k}" for k in range(N_PHASES)]
 93colors = ["#1f77b4" if abs(p) < 0.01 else "#d62728" for p in PHASES]
 94bars = ax.bar(range(N_PHASES), PHASES, color=colors, edgecolor="black")
 95ax.set_xticks(range(N_PHASES))
 96ax.set_xticklabels(phi_labels)
 97ax.axhline(0, color="gray", lw=0.5)
 98ax.set_xlabel("phase index")
 99ax.set_ylabel("phase value (rad)")
100ax.set_title(
101    f"QSVT phase factors (d={N_PHASES - 1}, optimized for sign)\n"
102    f"red = nonzero phase"
103)
104for i, p in enumerate(PHASES):
105    ax.text(i, p + (0.05 if p >= 0 else -0.08), f"{p:.3f}",
106            ha="center", va="bottom" if p >= 0 else "top", fontsize=9)
107ax.grid(axis="y", alpha=0.3)
108
109ax = axes[1]
110x_fine = np.linspace(-1, 1, 201)
111poly_fine = [qs_unitary(x, PHASES)[0, 0].real for x in x_fine]
112sign_fine = [float(np.sign(x)) if abs(x) > 1e-9 else 0.0 for x in x_fine]
113ax.plot(x_fine, poly_fine, "-", color="#1f77b4", lw=2,
114        label="QSVT polynomial P(x) = U[0,0]")
115ax.plot(x_fine, sign_fine, "--", color="#d62728", lw=2, label="ideal sign(x)")
116ax.axhline(0, color="gray", lw=0.5)
117ax.axvline(0, color="gray", lw=0.5)
118ax.set_xlabel("signal value x")
119ax.set_ylabel("polynomial value")
120ax.set_title(
121    f"Polynomial implemented by QSVT phases\n"
122    f"(d={N_PHASES - 1} Chebyshev-style, sign approx)"
123)
124ax.set_ylim(-1.5, 1.5)
125ax.legend(loc="upper left", fontsize=9)
126ax.grid(True, alpha=0.3)
127
128ax = axes[2]
129ax.plot(x_test, sign_vals, "k--", lw=1.5, label="ideal sign(x)")
130ax.scatter(x_test, [v for v in probs_p0], color="#1f77b4", s=60,
131           edgecolor="black", label=f"measured P(0) (shots={SHOTS})")
132ax.scatter(x_test, [v for v in probs_p1], color="#d62728", s=60,
133           edgecolor="black", label="measured P(1)", marker="s")
134for x, p0, p1 in zip(x_test, probs_p0, probs_p1):
135    if p0 > 0.55 or p1 > 0.55:
136        ax.text(x, max(p0, p1) + 0.05,
137                f"P(0)={p0:.2f}\nP(1)={p1:.2f}",
138                ha="center", va="bottom", fontsize=7)
139ax.set_xlabel("signal value x")
140ax.set_ylabel("P(0), P(1)")
141ax.set_title(
142    f"QSVT applied to |+>, measured in Z basis\n"
143    f"sign-like behavior: positive x -> mostly |0>, negative x -> mostly |1>"
144)
145ax.set_ylim(-0.05, 1.2)
146ax.legend(loc="upper center", fontsize=8)
147ax.grid(True, alpha=0.3)
148
149fig.suptitle(
150    f"QSVT sign approximation (single qubit, d=3)  "
151    f"(loss = {loss_sign(PHASES):.3f})",
152    fontsize=13, y=1.02,
153)
154plt.tight_layout()
155plt.savefig(OUT / "03_qsvt_sign.png", dpi=120, bbox_inches="tight")
156plt.close()
157
158
159print("ch05-hamiltonian-qsp demo 3: QSVT sign approximation (d=3)")
160print(f"  Phase factors (optimized for sign):")
161for i, p in enumerate(PHASES):
162    print(f"    phi_{i} = {p:.6f}")
163print(f"  loss = ||U[0,0](x) - sign(x)||^2 = {loss_sign(PHASES):.4f}")
164print(f"  Test points x and measured P(0), P(1):")
165for x, p0, p1 in zip(x_test, probs_p0, probs_p1):
166    sign_x = float(np.sign(x)) if abs(x) > 1e-9 else 0.0
167    print(f"    x={x:+.3f}: P(0)={p0:.3f}, P(1)={p1:.3f}  (sign={int(sign_x):+d})")
168print(f"  saved: {OUT / '03_qsvt_sign.png'}")
运行结果
运行方式
# 仓库根目录执行;输出 PNG 到 demos/ch05-hamiltonian-qsp/03_qsvt_sign.png,关键统计到 stdout
.venv/bin/python3 demos/ch05-hamiltonian-qsp/03_qsvt_sign.py