Demo 2:态层析¶
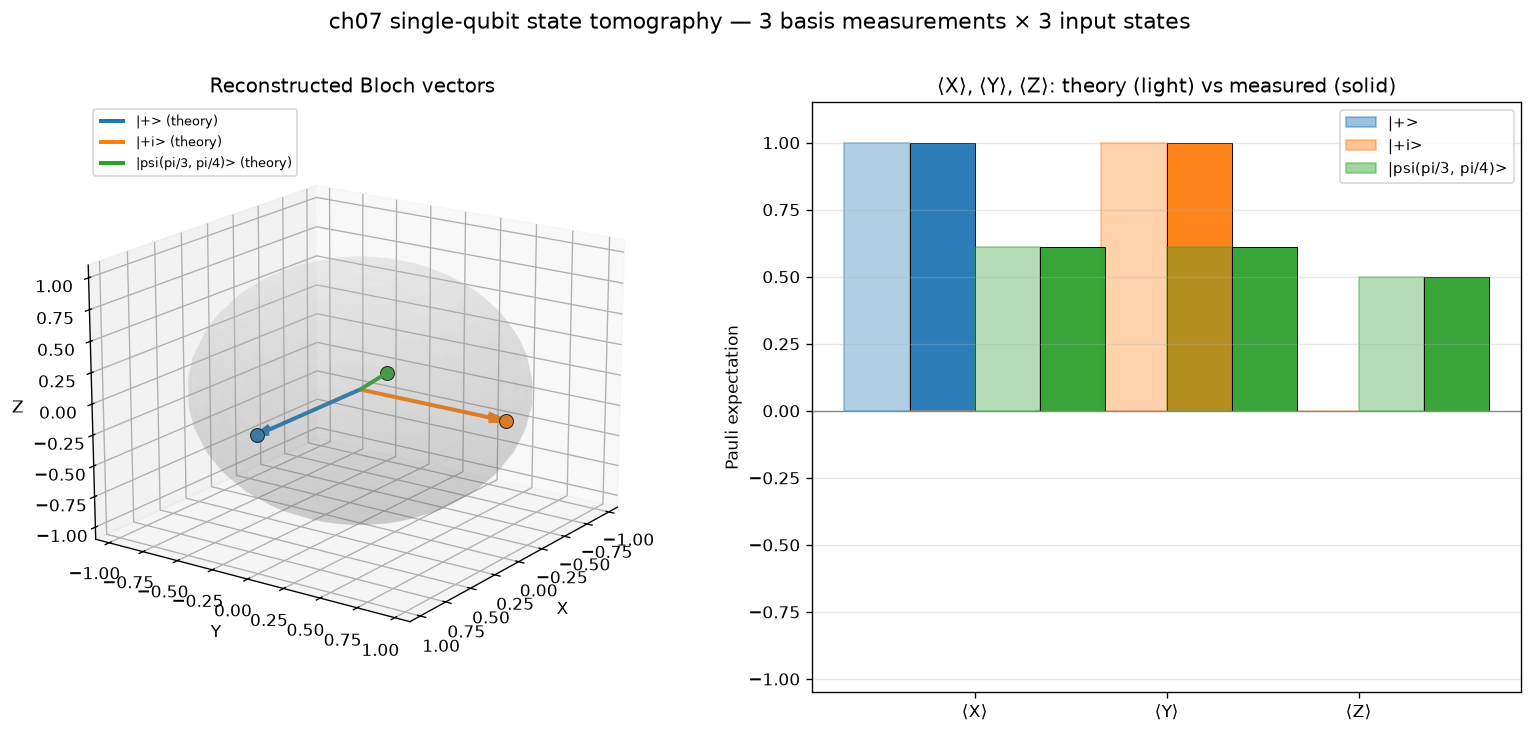
可视化:3D 球+3 子图 —— 3 态 3 基重建 Bloch 矢量
对应教程:第 7 章 量子信息 中相关小节 · 依赖安装:pip install "unified-quantum[visualization,simulation]"
实现要点¶
核心:对 3 个单 qubit 态做三轴 (X, Y, Z) 投影测量,重建 Bloch 矢量 并与理论值比较。
|+> = H|0> (target Bloch: (1, 0, 0))
|+i> = S·H|0> (target Bloch: (0, 1, 0))
|psi_tt> = RY(pi/3) P(pi/4) |0> (general mixed-axis state)
测量约定:
Z 基: 直接 measure(0)
X 基: H(0) 后 measure,⟨X⟩ = 2·P(0) - 1
Y 基: S†(0) H(0) 后 measure,⟨Y⟩ = 2·P(0) - 1
完整源码¶
demos/ch07-quantum-info/02_state_tomography.py¶
  1"""
  2ch07-quantum-info demo 2: single-qubit state tomography
  3
  4对应教程:chenzhaoyun.com/quantum-tutorial/chch07-quantum-info/02-state-tomography.html
  5依赖:pip install unified-quantum[visualization]
  6运行:python demos/ch07-quantum-info/02_state_tomography.py
  7
  8核心:对 3 个单 qubit 态做三轴 (X, Y, Z) 投影测量,重建 Bloch 矢量
  9并与理论值比较。
 10  - |+>         = H|0>          (target Bloch: (1, 0, 0))
 11  - |+i>        = S·H|0>        (target Bloch: (0, 1, 0))
 12  - |psi_tt>    = RY(pi/3) P(pi/4) |0>   (general mixed-axis state)
 13
 14测量约定:
 15  - Z 基: 直接 measure(0)
 16  - X 基: H(0) 后 measure,⟨X⟩ = 2·P(0) - 1
 17  - Y 基: S†(0) H(0) 后 measure,⟨Y⟩ = 2·P(0) - 1
 18"""
 19
 20from __future__ import annotations
 21
 22from pathlib import Path
 23
 24import matplotlib
 25matplotlib.use("Agg")
 26import matplotlib.pyplot as plt
 27import numpy as np
 28
 29from uniqc import Circuit, submit_task, wait_for_result
 30
 31OUT = Path(__file__).parent
 32SHOTS = 2000
 33
 34
 35# === 1. 单 qubit 三基态矢量期望测量 ===
 36def expectation_in_basis(state_prep, basis: str, shots: int = SHOTS) -> float:
 37    """对 state_prep 制备的态,在 basis (X/Y/Z) 上测 ⟨σ⟩ = 2·P(0) - 1。"""
 38    c = Circuit()
 39    state_prep(c)
 40    if basis == "X":
 41        c.h(0)
 42    elif basis == "Y":
 43        c.sdg(0)
 44        c.h(0)
 45    c.measure(0)
 46    r = wait_for_result(submit_task(c, backend="dummy:local:simulator", shots=shots))
 47    p0 = r.probabilities.get("0", 0.0)
 48    return 2.0 * p0 - 1.0
 49
 50
 51# === 2. 解析 Bloch 矢量 ===
 52def ry_p_state(theta: float, phi: float):
 53    """制备 RY(θ) P(φ) |0> = cos(θ/2)|0> + e^{iφ} sin(θ/2)|1>。"""
 54    def prep(c: Circuit) -> None:
 55        c.ry(0, theta)
 56        if phi != 0.0:
 57            c.p(0, phi)
 58    return prep
 59
 60
 61# === 3. 三个目标态 ===
 62def prep_plus(c: Circuit) -> None:
 63    c.h(0)
 64
 65
 66def prep_plus_i(c: Circuit) -> None:
 67    c.h(0)
 68    c.s(0)
 69
 70
 71PREPS = {
 72    "|+>": (prep_plus, np.array([1.0, 0.0, 0.0])),
 73    "|+i>": (prep_plus_i, np.array([0.0, 1.0, 0.0])),
 74    "|psi(pi/3, pi/4)>": (ry_p_state(np.pi / 3, np.pi / 4),
 75                    np.array([np.sin(np.pi / 3) * np.cos(np.pi / 4),
 76                              np.sin(np.pi / 3) * np.sin(np.pi / 4),
 77                              np.cos(np.pi / 3)])),
 78}
 79
 80
 81# === 4. 扫描每个态的 ⟨X⟩ ⟨Y⟩ ⟨Z⟩ ===
 82print("ch07-quantum-info demo 2: single-qubit state tomography")
 83results_table: dict[str, dict] = {}
 84bloch_measured = np.zeros((len(PREPS), 3))
 85bloch_theory = np.zeros((len(PREPS), 3))
 86labels = list(PREPS.keys())
 87
 88for idx, (name, (prep_fn, theory)) in enumerate(PREPS.items()):
 89    bloch_theory[idx] = theory
 90    exps = []
 91    for j, basis in enumerate(["X", "Y", "Z"]):
 92        val = expectation_in_basis(prep_fn, basis, shots=SHOTS)
 93        exps.append(val)
 94    bloch_measured[idx] = np.array(exps)
 95    results_table[name] = {
 96        "measured": bloch_measured[idx],
 97        "theory": bloch_theory[idx],
 98    }
 99    print(f"  {name:24s}  theory = ({theory[0]:+.3f}, {theory[1]:+.3f}, {theory[2]:+.3f})  "
100          f"measured = ({bloch_measured[idx, 0]:+.3f}, "
101          f"{bloch_measured[idx, 1]:+.3f}, {bloch_measured[idx, 2]:+.3f})")
102
103# 保真度 F = (1 + n_a · n_b) / 2,n 为 Bloch 矢量(纯态)
104print()
105for name, d in results_table.items():
106    fid = 0.5 * (1.0 + float(d["theory"] @ d["measured"]))
107    err = float(np.linalg.norm(d["measured"] - d["theory"]))
108    print(f"  {name:24s}  F = {fid:.4f}  ||meas-theory|| = {err:.4f}")
109
110
111# === 5. 画 2 子图 ===
112fig = plt.figure(figsize=(13.0, 6.0))
113ax_left = fig.add_subplot(1, 2, 1, projection="3d")
114ax_right = fig.add_subplot(1, 2, 2)
115
116colors = ["#1f77b4", "#ff7f0e", "#2ca02c"]
117
118# 左图:Bloch sphere 上的理论 vs 测量矢量
119u, v = np.mgrid[0:2 * np.pi:40j, 0:np.pi:20j]
120xs = np.cos(u) * np.sin(v)
121ys = np.sin(u) * np.sin(v)
122zs = np.cos(v)
123ax_left.plot_surface(xs, ys, zs, color="#dddddd", alpha=0.15, linewidth=0)
124ax_left.set_xlim(-1.1, 1.1)
125ax_left.set_ylim(-1.1, 1.1)
126ax_left.set_zlim(-1.1, 1.1)
127ax_left.set_xlabel("X")
128ax_left.set_ylabel("Y")
129ax_left.set_zlabel("Z")
130ax_left.set_title("Reconstructed Bloch vectors", fontsize=12)
131ax_left.view_init(elev=18, azim=35)
132
133origin = np.zeros(3)
134for i, (lab, c) in enumerate(zip(labels, colors)):
135    th = bloch_theory[i]
136    me = bloch_measured[i]
137    ax_left.quiver(*origin, th[0], th[1], th[2], color=c, arrow_length_ratio=0.12,
138                   linewidth=2.4, label=f"{lab} (theory)")
139    ax_left.quiver(*th, me[0] - th[0], me[1] - th[1], me[2] - th[2],
140                   color="black", arrow_length_ratio=0.18, linewidth=1.5,
141                   linestyle="--")
142    # 终点标记
143    ax_left.scatter(*me, color=c, s=70, marker="o", edgecolor="black",
144                    linewidth=0.6, zorder=10)
145ax_left.legend(loc="upper left", bbox_to_anchor=(0.05, 1.0), fontsize=8)
146
147# 右图:每个态在三个基上的 ⟨σ⟩,theory vs measured 双柱
148axes_labels = ["⟨X⟩", "⟨Y⟩", "⟨Z⟩"]
149x = np.arange(len(axes_labels))
150width = 0.34
151for i, (lab, c) in enumerate(zip(labels, colors)):
152    offset = (i - 1) * width
153    theory_bars = ax_right.bar(x + offset - width / 2, bloch_theory[i],
154                                width, color=c, alpha=0.35,
155                                edgecolor=c, linewidth=1.2,
156                                label=f"{lab} (theory)" if i == 0 else None)
157    meas_bars = ax_right.bar(x + offset + width / 2, bloch_measured[i],
158                              width, color=c, alpha=0.95,
159                              edgecolor="black", linewidth=0.6,
160                              label=f"{lab} (measured)" if i == 0 else None)
161ax_right.axhline(0, color="#888", lw=0.8)
162ax_right.set_xticks(x)
163ax_right.set_xticklabels(axes_labels)
164ax_right.set_ylim(-1.05, 1.15)
165ax_right.set_ylabel("Pauli expectation")
166ax_right.set_title("⟨X⟩, ⟨Y⟩, ⟨Z⟩: theory (light) vs measured (solid)", fontsize=12)
167ax_right.grid(axis="y", alpha=0.3)
168
169# 一次性 legend 显示三个态
170from matplotlib.patches import Patch
171from matplotlib.lines import Line2D
172legend_handles = []
173for i, lab in enumerate(labels):
174    legend_handles.append(Patch(facecolor=colors[i], alpha=0.45,
175                                edgecolor=colors[i], label=f"{lab}"))
176ax_right.legend(handles=legend_handles, loc="upper right", fontsize=9)
177
178plt.suptitle("ch07 single-qubit state tomography — 3 basis measurements × 3 input states",
179             fontsize=13, y=1.01)
180plt.tight_layout()
181out = OUT / "02_state_tomography.png"
182plt.savefig(out, dpi=120, bbox_inches="tight")
183plt.close()
184
185print(f"  PNG -> {out}")
运行结果¶
运行方式¶
# 仓库根目录执行;输出 PNG 到 demos/ch07-quantum-info/02_state_tomography.png,关键统计到 stdout
.venv/bin/python3 demos/ch07-quantum-info/02_state_tomography.py