Demo 3:谱和
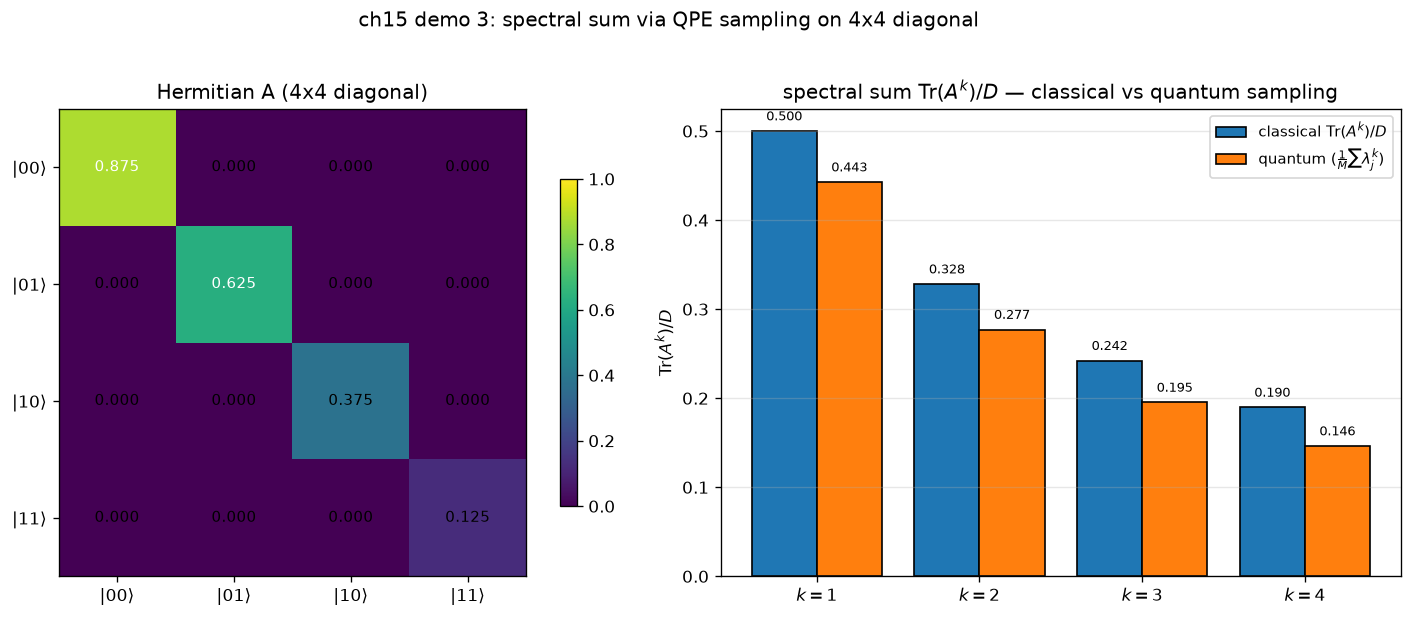
可视化:单子图(4 柱对比) —— Tr(A^k) Hadamard/QPE 估
对应教程:第 15 章 梯度、谱方法与量子机器学习 中相关小节 · 依赖安装:pip install "unified-quantum[visualization,simulation]"
实现要点
A = diag(7/8, 5/8, 3/8, 1/8); 3-bit QPE T_total = 2π ⇒ buckets hit midpoints exactly. QPE 从 |+⟩|+⟩ 均匀采样 {λ_j};Tr(A^k)/D = (1/M) Σ λ_j^k 与经典 Σ λ_j^k/D 对比。
完整源码
demos/ch15-learning-spectral/03_spectral_sums.py
  1"""
  2ch15 demo 3: spectral sum Tr(A^k) via quantum eigenvalue sampling on 4x4 diagonal A.
  3
  4对应教程:chenzhaoyun.com/quantum-tutorial/ch15-learning-spectral/spectral-sums.html
  5A = diag(7/8, 5/8, 3/8, 1/8); 3-bit QPE T_total = 2π ⇒ buckets hit midpoints exactly.
  6QPE 从 |+⟩|+⟩ 均匀采样 {λ_j};Tr(A^k)/D = (1/M) Σ λ_j^k 与经典 Σ λ_j^k/D 对比。
  7依赖:pip install unified-quantum[visualization]
  8"""
  9from __future__ import annotations
 10
 11from pathlib import Path
 12
 13import matplotlib
 14matplotlib.use("Agg")
 15import matplotlib.pyplot as plt
 16import numpy as np
 17
 18from uniqc import Circuit, submit_task, wait_for_result
 19
 20OUT = Path(__file__).parent
 21SHOTS = 2000
 22
 23# === A: 4x4 diagonal Hermitian (all positive) ===
 24# Eigenvalues land on 3-bit QPE bucket midpoints (m+0.5)/8 with T_total = 2π.
 25EIGS = np.array([7 / 8, 5 / 8, 3 / 8, 1 / 8])
 26A = np.diag(EIGS)
 27N_ANC = 3
 28N_SYS = 2
 29T = 2 * np.pi / 7  # 1+2+4 = 7 controlled-U applications, T_total = 7T = 2π
 30N_TOTAL = N_ANC + N_SYS
 31
 32
 33def diag_unitary_angles(phases):
 34    """Decompose 2-qubit diagonal U = diag(exp(iφ_kk)) as e^{iα·Z⊗Z} · e^{iβ·(Z⊗I)} · e^{iγ·(I⊗Z)}.
 35    Strip global phase φ_avg = Σφ/4 first.
 36    """
 37    phi00, phi01, phi10, phi11 = phases
 38    avg = (phi00 + phi01 + phi10 + phi11) / 4.0
 39    p00, p01, p10 = phi00 - avg, phi01 - avg, phi10 - avg
 40    return (-(p01 + p10) / 2.0, (p00 + p01) / 2.0, (p00 + p10) / 2.0)
 41
 42
 43def controlled_diag_unitary(c, anc, qs0, qs1, phases):
 44    alpha, beta, gamma = diag_unitary_angles(phases)
 45    two_beta = float((2 * beta) % (2 * np.pi))
 46    if abs(two_beta) > 1e-9:
 47        c.crz(qs0, anc, two_beta)
 48    two_gamma = float((2 * gamma) % (2 * np.pi))
 49    if abs(two_gamma) > 1e-9:
 50        c.crz(qs1, anc, two_gamma)
 51    c.toffoli(anc, qs0, qs1)
 52    two_alpha = float((2 * alpha) % (2 * np.pi))
 53    if abs(two_alpha) > 1e-9:
 54        c.crz(qs1, anc, two_alpha)
 55    c.toffoli(anc, qs0, qs1)
 56
 57
 58def build_qpe_circuit(eigs, t_param):
 59    n_total = N_ANC + N_SYS
 60    phases = list(eigs * t_param)
 61    c = Circuit()
 62    for q in range(n_total):
 63        c.h(q)
 64    c.barrier()
 65    for k in range(N_ANC):
 66        anc = k
 67        qs0, qs1 = N_ANC, N_ANC + 1
 68        for _ in range(2 ** k):
 69            controlled_diag_unitary(c, anc, qs0, qs1, phases)
 70    c.barrier()
 71    # Inverse QFT on ancilla (q0, q1, q2)
 72    if N_ANC > 1:
 73        c.swap(0, N_ANC - 1)
 74    for j in range(N_ANC - 1, -1, -1):
 75        c.h(j)
 76        for m in range(j):
 77            phase = -np.pi / (2 ** (j - m))
 78            c.cp(m, j, phase)
 79    c.barrier()
 80    for q in range(n_total):
 81        c.measure(q)
 82    return c
 83
 84
 85# === Classical spectral sums ===
 86KS = [1, 2, 3, 4]
 87classical_trace = [float(np.trace(np.linalg.matrix_power(A, k))) for k in KS]
 88classical_trace_over_D = [t / A.shape[0] for t in classical_trace]
 89
 90T_total = (2 ** N_ANC - 1) * T
 91print("ch15-learning-spectral demo 3: spectral sum Tr(A^k) via QPE sampling")
 92print(f"  A diagonal eigenvalues: {EIGS.tolist()}")
 93print(f"  3-bit QPE, T = {T:.4f}, T_total = {T_total:.4f} = 2π")
 94print(f"  total = {N_TOTAL} qubits, shots = {SHOTS}")
 95print(f"  Classical Tr(A^k) for k = {KS}:")
 96for k, tr, td in zip(KS, classical_trace, classical_trace_over_D):
 97    print(f"    k={k}: Tr(A^{k}) = {tr:+.4f}    Tr(A^{k})/D = {td:+.4f}")
 98
 99# === Build & submit QPE ===
100c = build_qpe_circuit(EIGS, T)
101print(f"  circuit depth = {c.depth}")
102
103result = wait_for_result(submit_task(circuit=c, backend="dummy:local:simulator", shots=SHOTS))
104counts = result.counts
105total = sum(max(0, v) for v in counts.values())
106
107anc_counts = {}
108for bs, cnt in counts.items():
109    if cnt <= 0:
110        continue
111    anc_bs = bs[:N_ANC]
112    anc_counts[anc_bs] = anc_counts.get(anc_bs, 0) + cnt
113
114
115def bucket_to_eig(b):
116    """Recover λ from QPE bucket b: phase = (b+0.5)/2^N, λ = phase · 2π/T_total."""
117    phase = (b + 0.5) / (2 ** N_ANC)
118    eig = phase * 2 * np.pi / T_total
119    return ((eig + 1.0) % 2.0) - 1.0
120
121
122# Build per-shot eigenvalue list from histogram
123sample_eigs = []
124for bs, cnt in counts.items():
125    if cnt <= 0:
126        continue
127    b = int(bs[:N_ANC], 2)
128    sample_eigs.extend([bucket_to_eig(b)] * cnt)
129sample_eigs = np.array(sample_eigs)
130M = sample_eigs.size
131
132print(f"  total shots: {total}, recovered-sample count: {M}")
133print(f"  QPE bucket histogram:")
134for k in range(2 ** N_ANC):
135    bs = format(k, f"0{N_ANC}b")
136    cnt = anc_counts.get(bs, 0)
137    print(f"    bucket {k:2d} (anc={bs}): {cnt:5d} shots  ({cnt / max(total, 1) * 100:5.1f}%)")
138
139# Quantum estimate of Tr(A^k)/D for k = 1..4
140quantum_trace_over_D = []
141for k in KS:
142    qk = float(np.mean(sample_eigs ** k))
143    quantum_trace_over_D.append(qk)
144    print(f"    Tr(A^{k})/D quantum estimate = {qk:+.4f}")
145
146# === matplotlib 可视化 ===
147fig, (ax1_ax, ax2_ax) = plt.subplots(1, 2, figsize=(12.5, 5.0))
148
149# Left: matrix A heatmap
150im = ax1_ax.imshow(A, cmap="viridis", vmin=0, vmax=1)
151for i in range(4):
152    for j in range(4):
153        ax1_ax.text(j, i, f"{A[i, j]:.3f}", ha="center", va="center",
154                    color="white" if A[i, j] > 0.5 else "black", fontsize=9)
155ax1_ax.set_xticks(range(4))
156ax1_ax.set_yticks(range(4))
157ax1_ax.set_xticklabels([f"|{i:02b}⟩" for i in range(4)])
158ax1_ax.set_yticklabels([f"|{i:02b}⟩" for i in range(4)])
159ax1_ax.set_title("Hermitian A (4x4 diagonal)")
160plt.colorbar(im, ax=ax1_ax, shrink=0.7)
161
162# Right: classical vs quantum Tr(A^k)/D bar chart
163x = np.arange(len(KS))
164w = 0.4
165classical_vals = classical_trace_over_D
166quantum_vals = quantum_trace_over_D
167ax2_ax.bar(x - w / 2, classical_vals, w, color="#1f77b4", ec="black",
168           label=r"classical $\mathrm{Tr}(A^k)/D$")
169ax2_ax.bar(x + w / 2, quantum_vals, w, color="#ff7f0e", ec="black",
170           label=r"quantum $(\frac{1}{M}\sum\lambda_j^k)$")
171for i in range(len(KS)):
172    ax2_ax.text(i - w / 2, classical_vals[i] + 0.012, f"{classical_vals[i]:.3f}",
173                ha="center", fontsize=8)
174    ax2_ax.text(i + w / 2, quantum_vals[i] + 0.012, f"{quantum_vals[i]:.3f}",
175                ha="center", fontsize=8)
176ax2_ax.set_xticks(x)
177ax2_ax.set_xticklabels([f"$k={k}$" for k in KS])
178ax2_ax.set_ylabel(r"$\mathrm{Tr}(A^k)/D$")
179ax2_ax.set_title(r"spectral sum $\mathrm{Tr}(A^k)/D$ — classical vs quantum sampling")
180ax2_ax.legend(loc="upper right", fontsize=9)
181ax2_ax.grid(alpha=0.3, axis="y")
182
183plt.suptitle("ch15 demo 3: spectral sum via QPE sampling on 4x4 diagonal", y=1.02)
184plt.tight_layout()
185out_path = OUT / "03_spectral_sums.png"
186plt.savefig(out_path, dpi=120, bbox_inches="tight")
187plt.close()
188
189# === stdout key stats ===
190max_err = float(np.max(np.abs(np.array(quantum_trace_over_D) - np.array(classical_trace_over_D))))
191print()
192print(f"  classical Tr(A^k)/D:   {[round(v, 4) for v in classical_trace_over_D]}")
193print(f"  quantum Tr(A^k)/D:     {[round(v, 4) for v in quantum_trace_over_D]}")
194print(f"  max |quantum - classical|: {max_err:.4f}")
195print(f"  M (effective samples): {M}")
196print(f"  PNG -> {out_path}")
运行结果
运行方式
# 仓库根目录执行;输出 PNG 到 demos/ch15-learning-spectral/03_spectral_sums.png,关键统计到 stdout
.venv/bin/python3 demos/ch15-learning-spectral/03_spectral_sums.py