Demo 3:QNN 拟合 sin(x)
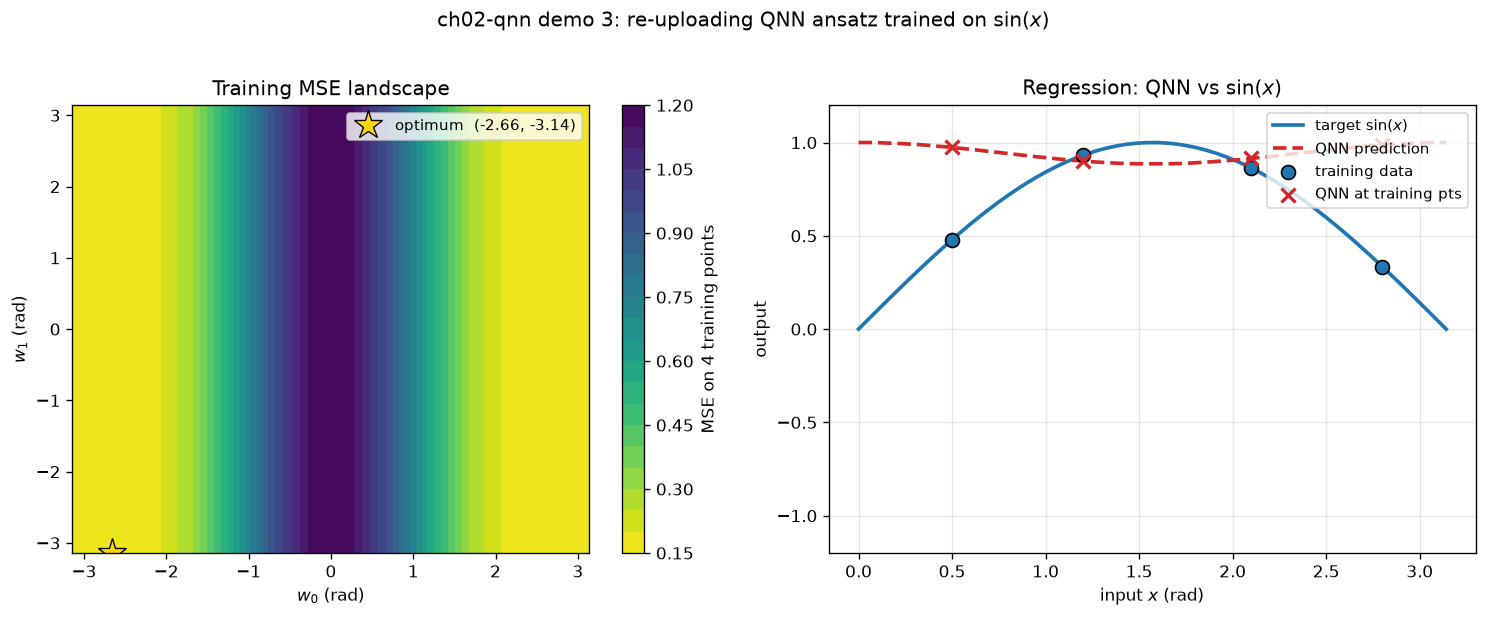
可视化:双图:MSE 等高线+拟合曲线 —— 1-qubit re-uploading ansatz 网格搜索最优点
对应教程:第 2 章 量子神经网络 中相关小节 · 依赖安装:pip install "unified-quantum[visualization,simulation]"
实现要点
核心:1-qubit data re-uploading ansatz |ψ(x, w)⟩ = RY(x) · RZ(w0) · RY(x) · RZ(w1) · |0⟩ 预测 f(x, w) = ⟨ψ(x, w)|Z|ψ(x, w)⟩ 用 4 个训练点 (x_i, sin(x_i)) 在 w ∈ [-π, π]² 上做网格搜索, 找到使 MSE 最小的 (w0*, w1*),然后在同一网格上画出预测曲线。
完整源码
demos/ch02-qnn/03_qnn_ansatz.py
  1"""
  2ch02-qnn demo 3: 2-qubit re-uploading ansatz + sin regression
  3
  4对应教程:chenzhaoyun.com/quantum-tutorial/ch02-quantum-nn/quantum-neural-network.html
  5核心:1-qubit data re-uploading ansatz
  6       |ψ(x, w)⟩ =  RY(x) · RZ(w0) · RY(x) · RZ(w1) · |0⟩
  7       预测      f(x, w) = ⟨ψ(x, w)|Z|ψ(x, w)⟩
  8用 4 个训练点 (x_i, sin(x_i)) 在 w ∈ [-π, π]² 上做网格搜索,
  9找到使 MSE 最小的 (w0*, w1*),然后在同一网格上画出预测曲线。
 10
 11依赖:pip install unified-quantum[visualization]
 12运行:python demos/ch02-qnn/03_qnn_ansatz.py
 13"""
 14from __future__ import annotations
 15
 16from pathlib import Path
 17
 18import matplotlib
 19matplotlib.use("Agg")
 20import matplotlib.pyplot as plt
 21import numpy as np
 22
 23from uniqc import Circuit, submit_task, wait_for_result
 24
 25OUT = Path(__file__).parent
 26
 27SHOTS = 2000
 28
 29
 30def expectation_z_single(theta: float, phi: float, x: float, shots: int = SHOTS) -> float:
 31    """对 1-qubit re-uploading 线路 U(x,w)|0⟩ 测 ⟨Z⟩。
 32
 33    线路顺序(从 |0⟩ 开始):RY(x) → RZ(w0) → RY(x) → RZ(w1)
 34    """
 35    c = Circuit()
 36    c.ry(0, float(x))
 37    c.rz(0, float(theta))
 38    c.ry(0, float(x))
 39    c.rz(0, float(phi))
 40    c.measure(0)
 41    r = wait_for_result(submit_task(c, backend="dummy:local:simulator", shots=shots))
 42    p = r.probabilities
 43    return float(p.get("0", 0.0) - p.get("1", 0.0))
 44
 45
 46# === 1. 训练数据 ===
 47train_x = np.array([0.5, 1.2, 2.1, 2.8])              # 4 个输入点
 48train_y = np.sin(train_x)                              # 目标函数值
 49
 50# === 2. 在 (w0, w1) 网格上搜索最小 MSE ===
 51GRID = 14
 52w0_grid = np.linspace(-np.pi, np.pi, GRID)
 53w1_grid = np.linspace(-np.pi, np.pi, GRID)
 54mse_grid = np.full((GRID, GRID), np.nan)
 55
 56print(f"ch02-qnn-demo-3: grid search over {GRID}x{GRID} = {GRID*GRID} ansatz params")
 57total_evals = 0
 58for i, w0 in enumerate(w0_grid):
 59    for j, w1 in enumerate(w1_grid):
 60        preds = np.array([expectation_z_single(w0, w1, x) for x in train_x])
 61        mse_grid[i, j] = float(np.mean((preds - train_y) ** 2))
 62        total_evals += 1
 63print(f"  total quantum evaluations during search: {total_evals * len(train_x)}")
 64
 65i_best, j_best = np.unravel_index(int(np.nanargmin(mse_grid)), mse_grid.shape)
 66w0_star, w1_star = float(w0_grid[i_best]), float(w1_grid[j_best])
 67best_mse = float(mse_grid[i_best, j_best])
 68
 69# === 3. 在密网格上画预测曲线 ===
 70x_plot = np.linspace(0.0, np.pi, 60)
 71y_target = np.sin(x_plot)
 72y_pred = np.array([expectation_z_single(w0_star, w1_star, x) for x in x_plot])
 73print(f"  best (w0*, w1*) = ({w0_star:+.3f}, {w1_star:+.3f})  →  train MSE = {best_mse:.4f}")
 74
 75# 训练点的预测
 76y_train_pred = np.array([expectation_z_single(w0_star, w1_star, x) for x in train_x])
 77
 78# === 4. 绘图:损失等高线 + 预测曲线对比 ===
 79fig, (ax1, ax2) = plt.subplots(1, 2, figsize=(12.5, 5.0))
 80
 81# 左图:损失景观
 82W0, W1 = np.meshgrid(w0_grid, w1_grid, indexing="ij")
 83cs = ax1.contourf(W0, W1, mse_grid, levels=20, cmap="viridis_r")
 84ax1.plot(w0_star, w1_star, "*", color="#ffd700", ms=18, mec="black", mew=0.8,
 85         label=f"optimum  ({w0_star:+.2f}, {w1_star:+.2f})")
 86ax1.set_xlabel(r"$w_0$ (rad)")
 87ax1.set_ylabel(r"$w_1$ (rad)")
 88ax1.set_title("Training MSE landscape")
 89ax1.legend(loc="upper right", fontsize=9)
 90cbar = plt.colorbar(cs, ax=ax1)
 91cbar.set_label("MSE on 4 training points")
 92
 93# 右图:预测曲线 vs 真实 sin
 94ax2.plot(x_plot, y_target, color="#1f77b4", lw=2.2, label=r"target $\sin(x)$")
 95ax2.plot(x_plot, y_pred, color="#d62728", lw=2.2, ls="--", label="QNN prediction")
 96ax2.scatter(train_x, train_y, s=70, color="#1f77b4", ec="black", zorder=5, label="training data")
 97ax2.scatter(train_x, y_train_pred, s=70, marker="x", color="#d62728", zorder=5, lw=2,
 98            label="QNN at training pts")
 99ax2.set_xlabel(r"input $x$ (rad)")
100ax2.set_ylabel("output")
101ax2.set_title("Regression: QNN vs $\\sin(x)$")
102ax2.set_ylim(-1.2, 1.2)
103ax2.grid(alpha=0.3)
104ax2.legend(loc="upper right", fontsize=9)
105
106plt.suptitle("ch02-qnn demo 3: re-uploading QNN ansatz trained on $\\sin(x)$", y=1.02)
107plt.tight_layout()
108out_path = OUT / "03_qnn_ansatz.png"
109plt.savefig(out_path, dpi=120, bbox_inches="tight")
110plt.close()
111
112# === 5. stdout 关键统计 ===
113print("ch02-qnn-demo-3: QNN regression on sin(x)")
114print(f"  training samples: {len(train_x)}  (x in {train_x.tolist()})")
115print(f"  best ansatz params: w0* = {w0_star:+.4f}, w1* = {w1_star:+.4f}")
116print(f"  training MSE      : {best_mse:.4f}")
117print(f"  train y true  : {train_y.tolist()}")
118print(f"  train y pred  : {[f'{v:+.4f}' for v in y_train_pred]}")
119print(f"  curve points  : {len(x_plot)}  (x in [0, π])")
120print(f"  PNG -> {out_path}")
运行结果
运行方式
# 仓库根目录执行;输出 PNG 到 demos/ch02-qnn/03_qnn_ansatz.png,关键统计到 stdout
.venv/bin/python3 demos/ch02-qnn/03_qnn_ansatz.py